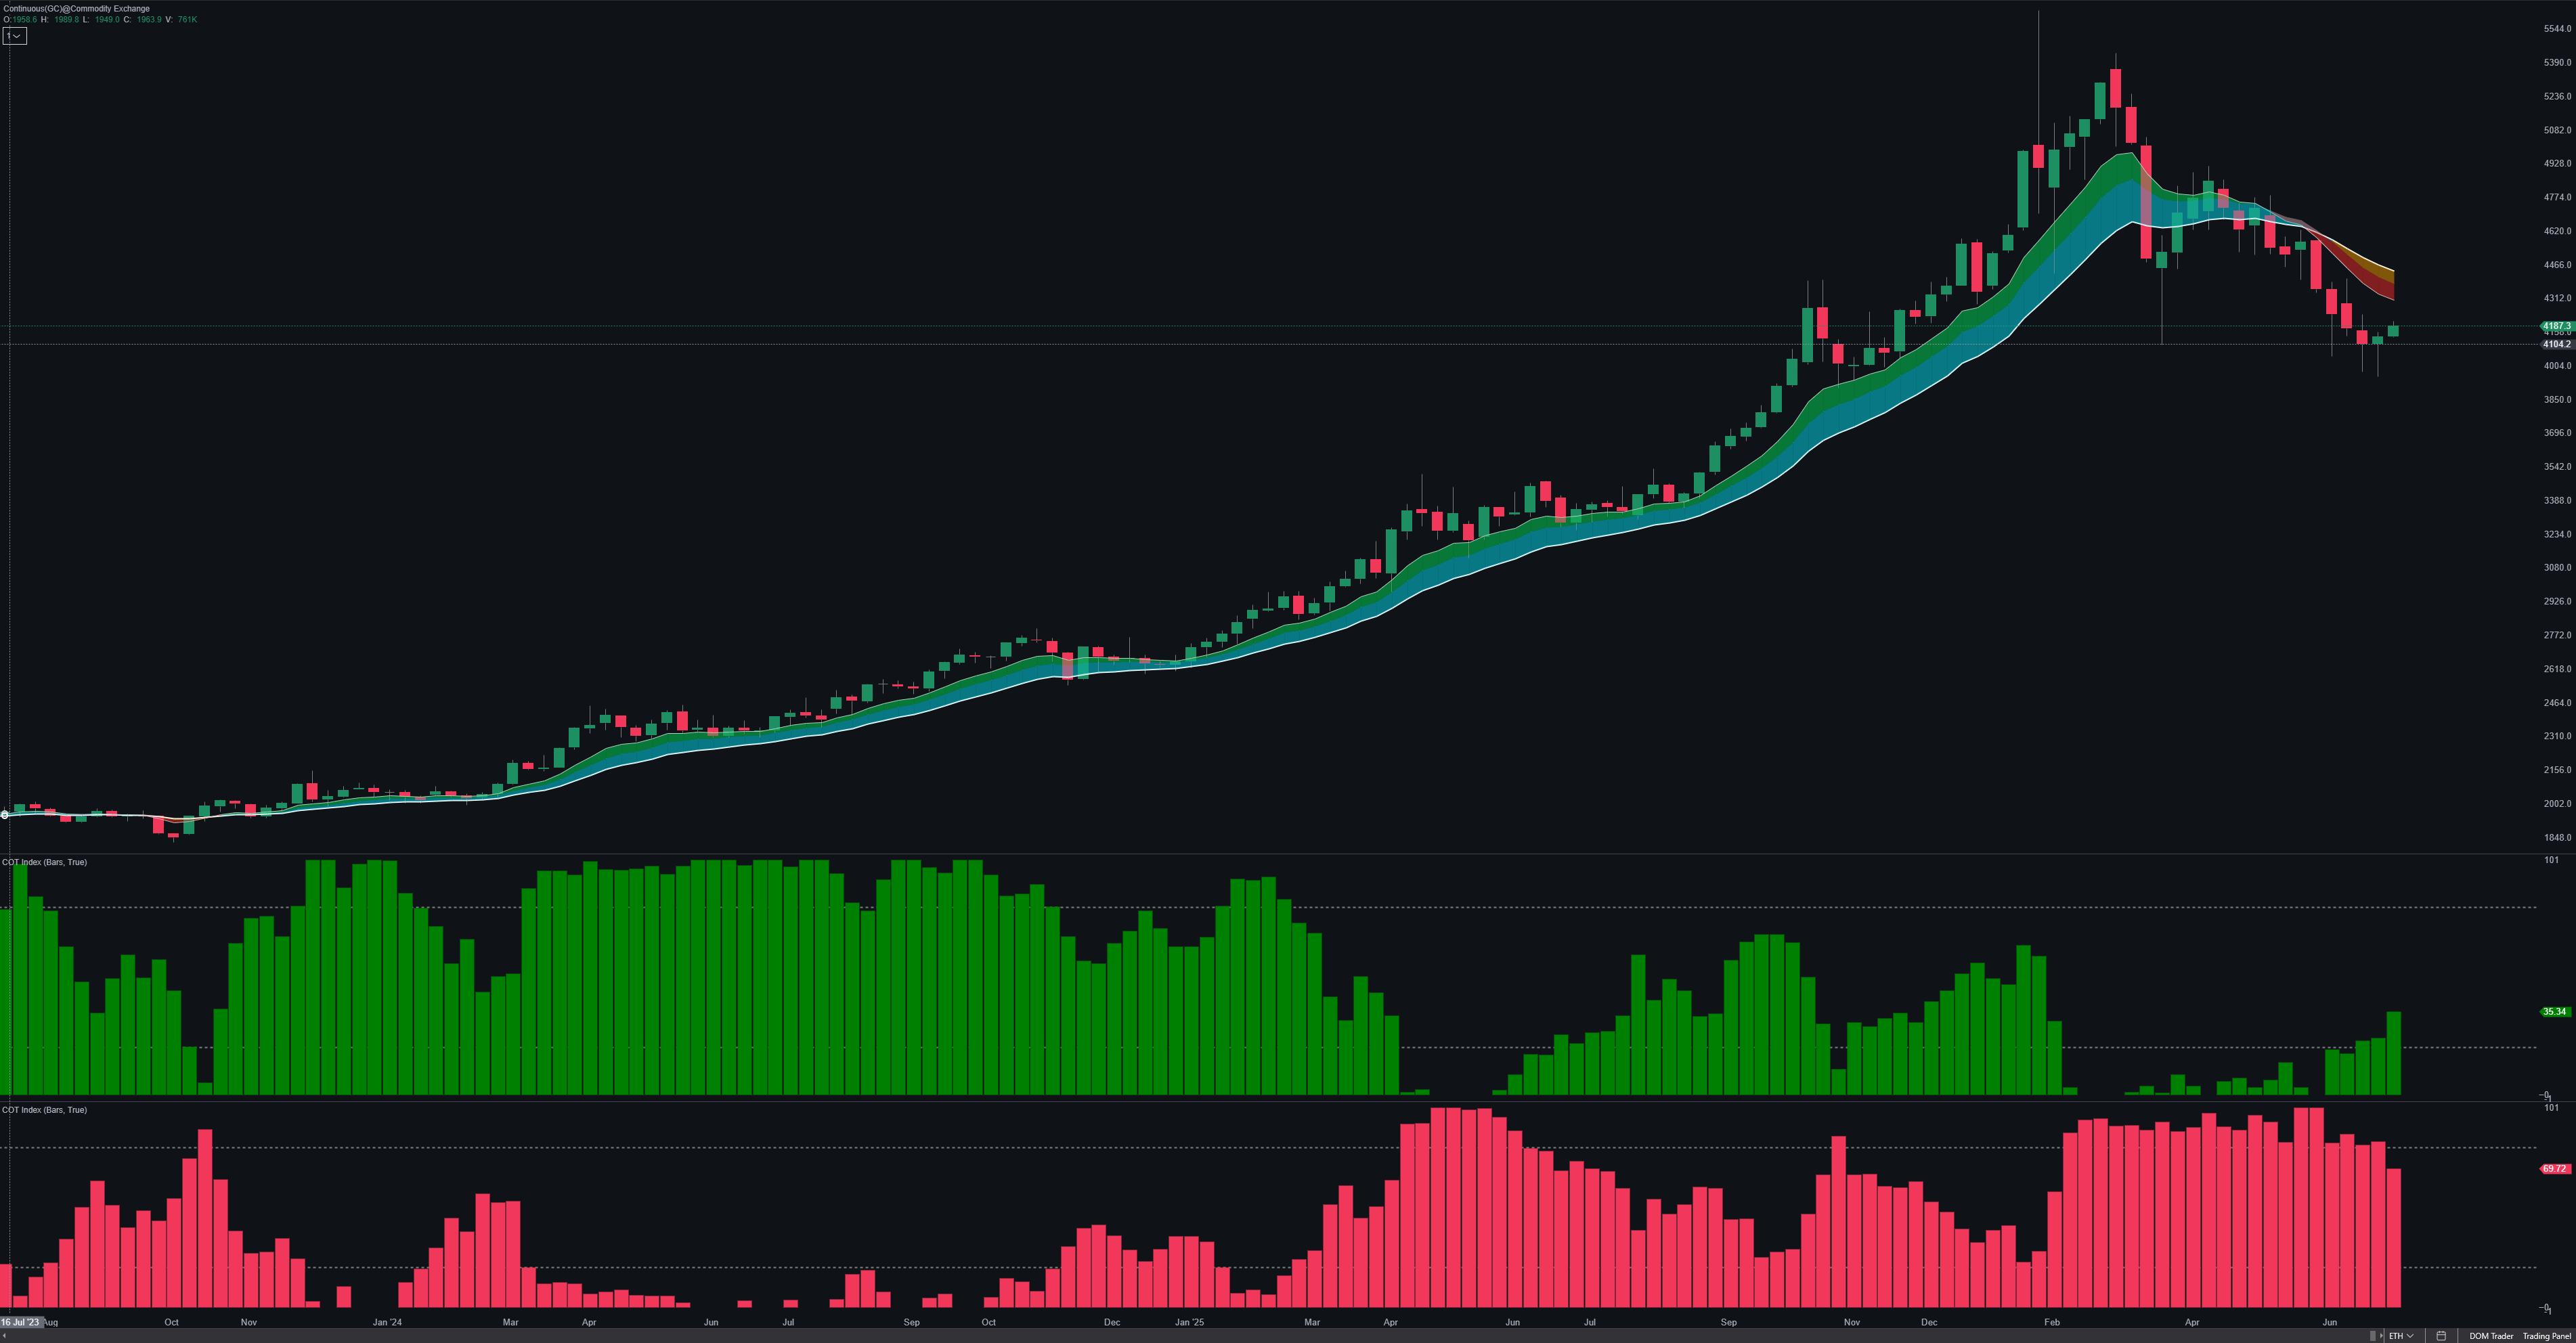
In January, silver reached a record near $121 and lost more than thirty percent of it in less than a week, including its worst session since 1980. Gold followed a similar path. It gained roughly 29.5 percent during the month, peaked near $5,600 on January 29, and then fell about ten percent in the days that followed.
The common explanation is that the debasement trade became crowded and was forced to unwind. That is probably right. It also explains why the five months after the crash tell us more than the crash itself.
The rest of this briefing is for readers on the list.
Free, permanently. Enter your email and a link comes back that unlocks every piece on the site, current and future.
Part I: The month with a name on it
The January decline was not caused by a sudden change in mine supply, industrial demand, or official-sector buying. It began after the nomination of a new Federal Reserve chair revived demand for the dollar and weakened a trade that had been built partly around concerns over central-bank independence. Exchange margin increases then added pressure to positions that were already heavily leveraged.
Nobody woke up on Thursday and changed their mind about the electrical conductivity of silver.
That distinction matters because large positioning changes are normal during violent price moves. When leverage is forced out, traders sell because their risk limits, margin requirements, or balance sheets tell them to sell. The movement may be dramatic, but the behavior underneath it is often predictable.
A building falling during an earthquake tells us less about its construction than a building falling on a quiet Tuesday afternoon. January was the earthquake. The useful question is what participants continued doing after the ground stopped moving.
Part II: What happened after the crash
By July, silver was trading at roughly half its January high. Speculative positioning had fallen close to the bottom of its historical range, while commercial positioning had moved close to the top of its own. Gold showed the same broad structure, though the divide between the two groups was less extreme.
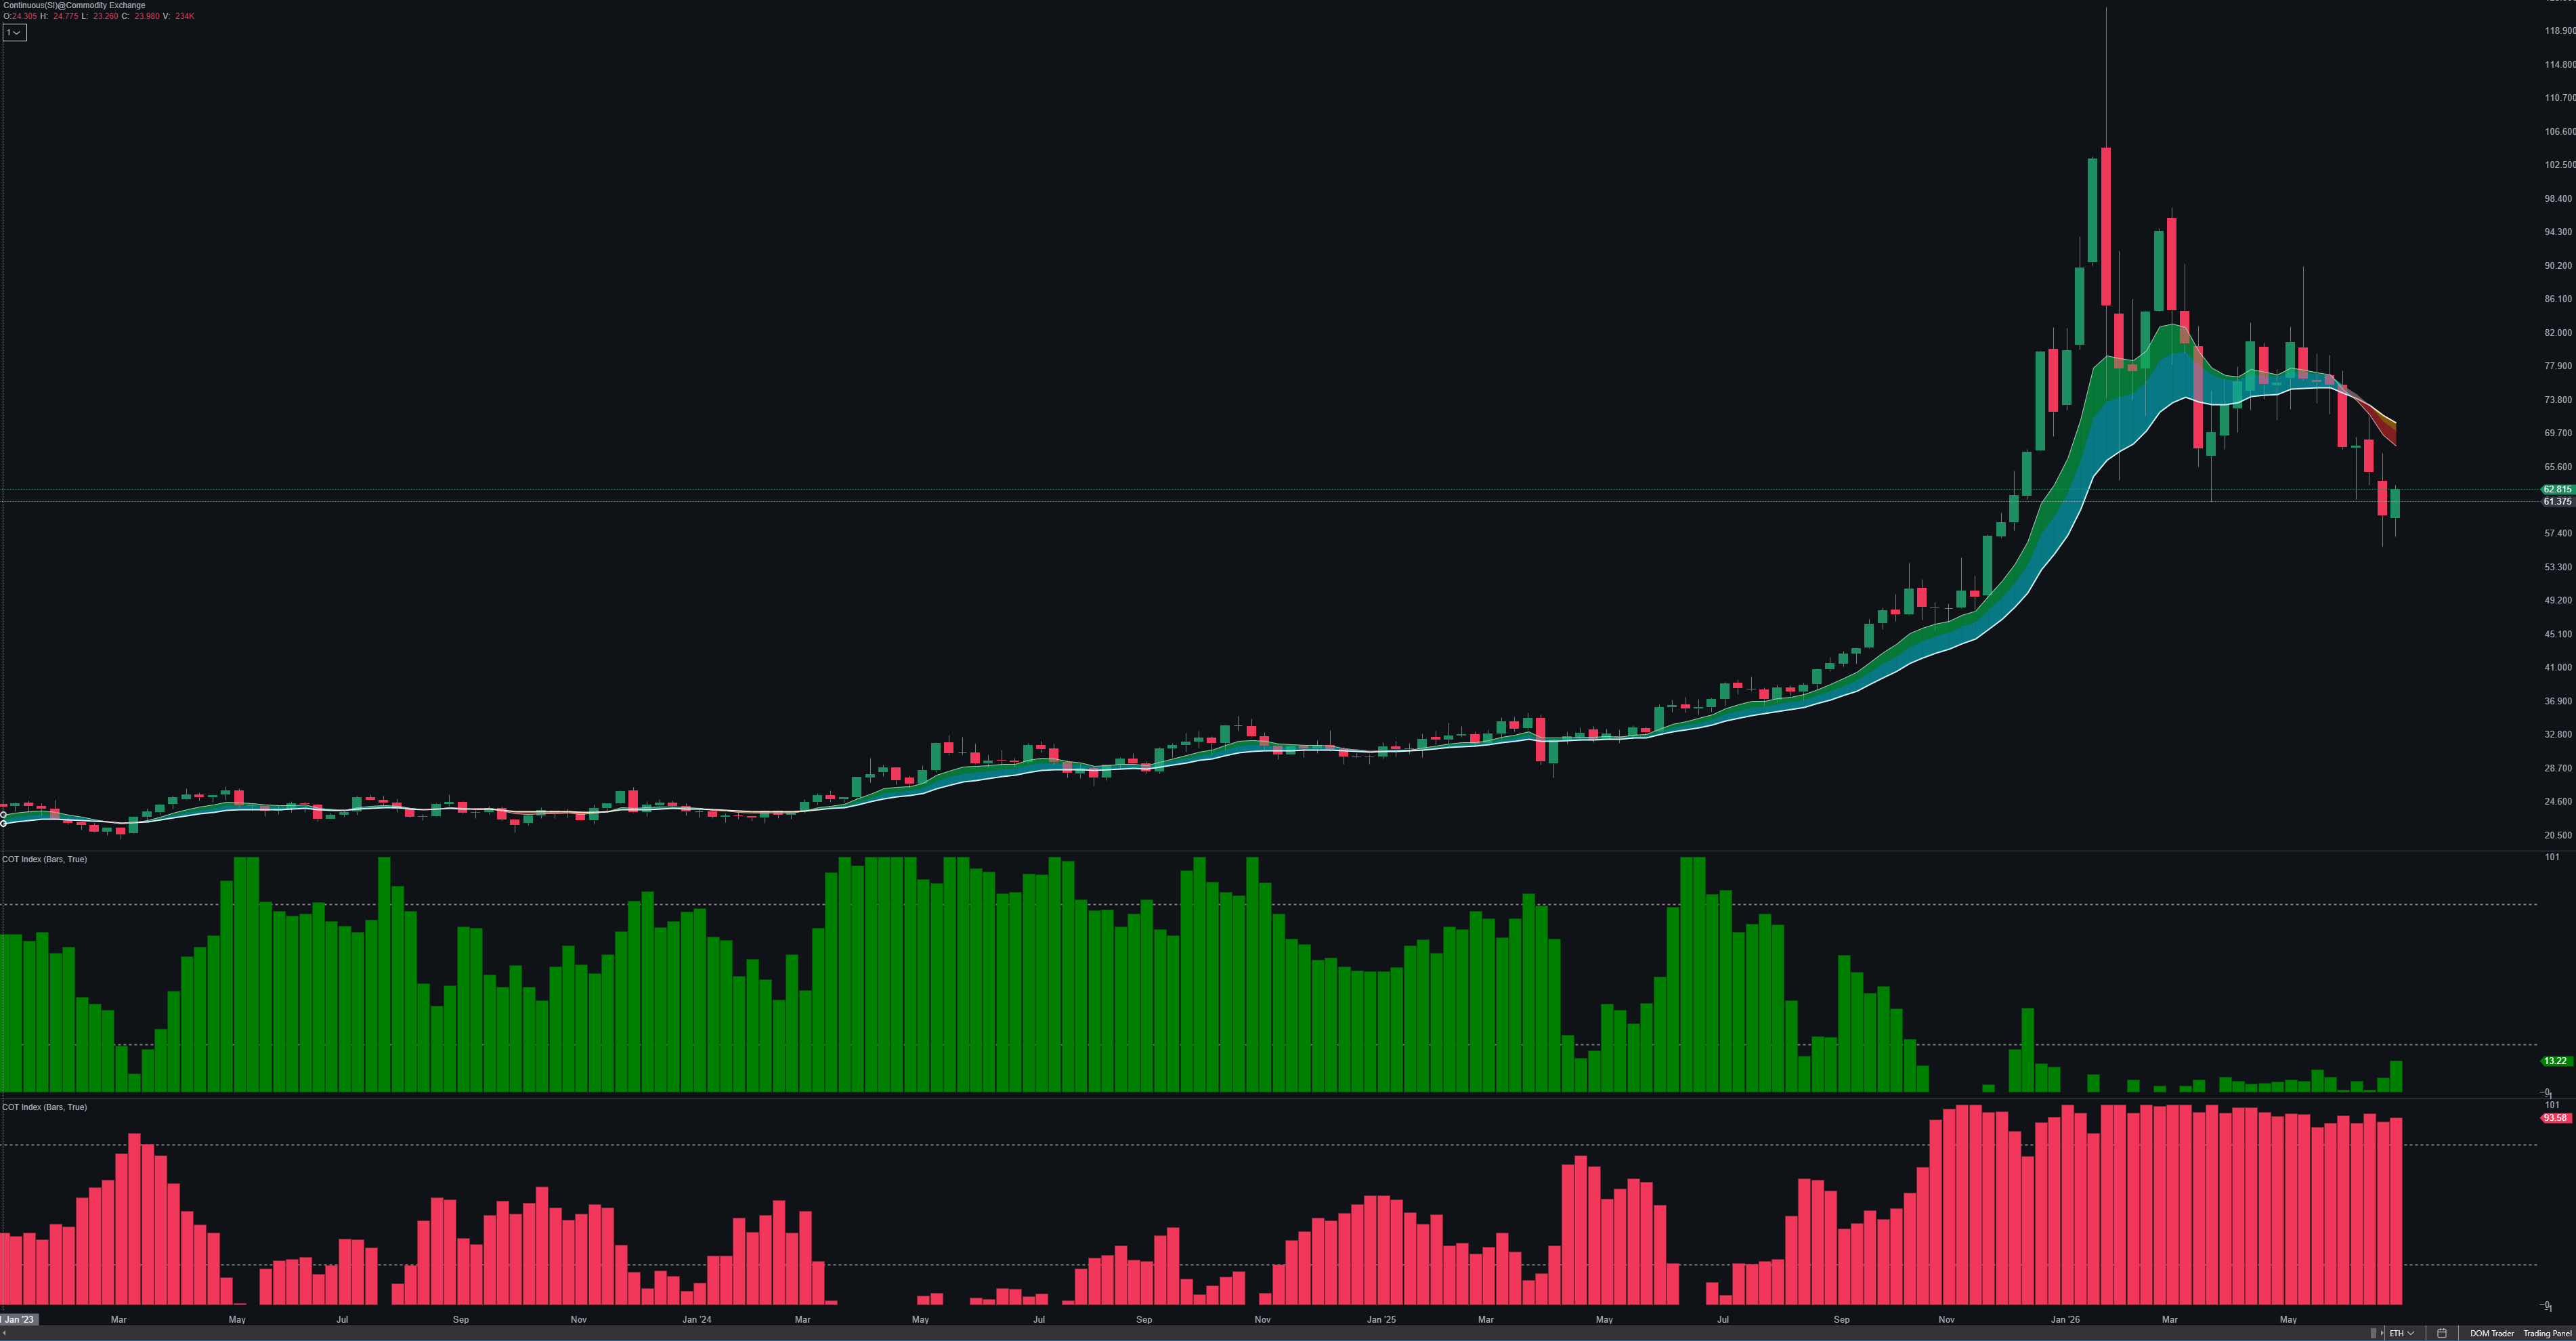
In simpler terms, the traders who had been most exposed to the rally had largely left, while commercial participants had accumulated positions through the decline. More importantly, that accumulation did not end once the immediate pressure passed. It continued for another five months, long after the original catalyst had been absorbed and the market had moved on to other things.
We cannot know why these participants are positioned this way, and the data should not be stretched into an explanation it cannot provide. What we can measure is the behavior itself. Commercial exposure was rebuilt repeatedly across several months while prices remained well below their January highs.
One month of buying can be a reaction. Five months is a pattern.
Silver's falling open interest adds another piece to the picture. Open interest measures the number of outstanding contracts, and when it declines alongside price, it usually means participants are closing positions rather than creating new ones. In plain language, leveraged longs have been leaving, but a large new population of short sellers has not taken their place.
Those two conditions can look identical on a price chart. Both produce lower prices. Underneath the surface, however, one market is attracting committed sellers while the other is simply losing exhausted buyers.
Silver appears closer to the second.
Part III: The control group nobody asked for
Copper helps narrow the explanation. It is trading near its highs with speculative positioning close to the upper end of its historical range and commercial positioning close to the lower end. That is almost the exact opposite of what we see in gold and silver.
The difference weakens the argument that commercial accumulation in precious metals is simply part of a broad commodity trade. If this were mainly a reflation position, a general inflation hedge, or widespread demand for commodities, copper should show something similar. It does not.
This does not prove what is driving the difference, and we do not need to pretend that it does. It tells us that the explanation is probably more specific to monetary metals than to commodities as a whole.
Sometimes analysis improves by finding the answer. Sometimes it improves by removing the answers that no longer fit.
Part IV: The uncomfortable backdrop
The June Federal Reserve projections raised the median expected year-end policy rate from 3.4 percent to 3.8 percent, while nine of nineteen participants projected additional increases. Higher real rates are normally difficult for gold and silver because neither asset produces income, making interest-bearing alternatives more attractive.
Commercial accumulation has continued anyway.
That is the tension worth preserving. The positioning is not building against a neutral backdrop. It is building against one that should, at least in theory, make the metals less attractive.
There are possible explanations. Inflation reached a three-year high of 4.2 percent in May, core PCE remained near 3 percent, and the conflict with Iran added pressure through energy prices. But using those facts to make the contradiction disappear misses the point.
If the backdrop clearly supported the position, the position would be easier to understand and probably more widely held. The disagreement is what makes it informative. Participants have continued rebuilding exposure while the market has repeatedly given them reasons not to.
Asymmetry rarely begins where everyone is already comfortable.
Part V: What the position changes
Speculative positioning in silver is now close to historical exhaustion. That does not mean the price must rise, and it does not mean the downside has disappeared. It means one of the market's easiest sources of selling has already been largely used.
There are fewer speculative longs left to liquidate and fewer participants left to shift from bullish exposure into bearish exposure. For the decline to continue in the same way, the market may need a new source of pressure rather than simply more of the old one.
The next useful test would be a bearish development that fails to produce a new low. That could be a strong dollar session, a hot inflation report, or another move higher in real rates. The headline would matter, but the response would matter more.
When bad news stops producing lower prices, the structure underneath the market may finally be affecting the tape.
Two developments would weaken this interpretation. The first would be speculative positioning returning toward normal levels without any meaningful recovery in price. That would suggest the depleted positioning was absorbed without producing a repricing.
The second would be commercial positioning falling as silver moves to new lows. That would show the accumulation was not as persistent as it first appeared, and that we had read too much into it.
One caveat remains. During an acute liquidity event, metals can be sold alongside everything else because participants need cash or collateral. January is a recent example. A depleted speculative base may reduce one source of pressure, but it does not make silver immune from forced selling.
A positioning extreme is a condition, not a trigger. It does not tell us what the market will do next. It tells us what the market may be running out of ways to do easily.
Silver is not guaranteed to rise.
There may simply be nobody left to sell it the way they did before.